Navigating Hasura
This page is only relevant when testing on a local machine or using a self-hosted version of Envio that uses Hasura.
Introduction
Hasura is a GraphQL engine that provides a web interface for interacting with your indexed blockchain data. When running HyperIndex locally, Hasura serves as your primary tool for:
- Querying indexed data via GraphQL
- Visualizing database tables and relationships
- Testing API endpoints before integration with your frontend
- Monitoring the indexing process
This guide explains how to navigate the Hasura dashboard to effectively work with your indexed data.
Accessing Hasura Console
When running HyperIndex locally, Hasura Console is automatically available at:
http://localhost:8080
You can access this URL in any web browser to open the Hasura console.
When prompted for authentication, use the password: testing
Key Dashboard Areas
The Hasura dashboard has several tabs, but we'll focus on the two most important ones for HyperIndex developers:
API Tab
The API tab lets you execute GraphQL queries and mutations on indexed data. It serves as a GraphQL playground for testing your API calls.
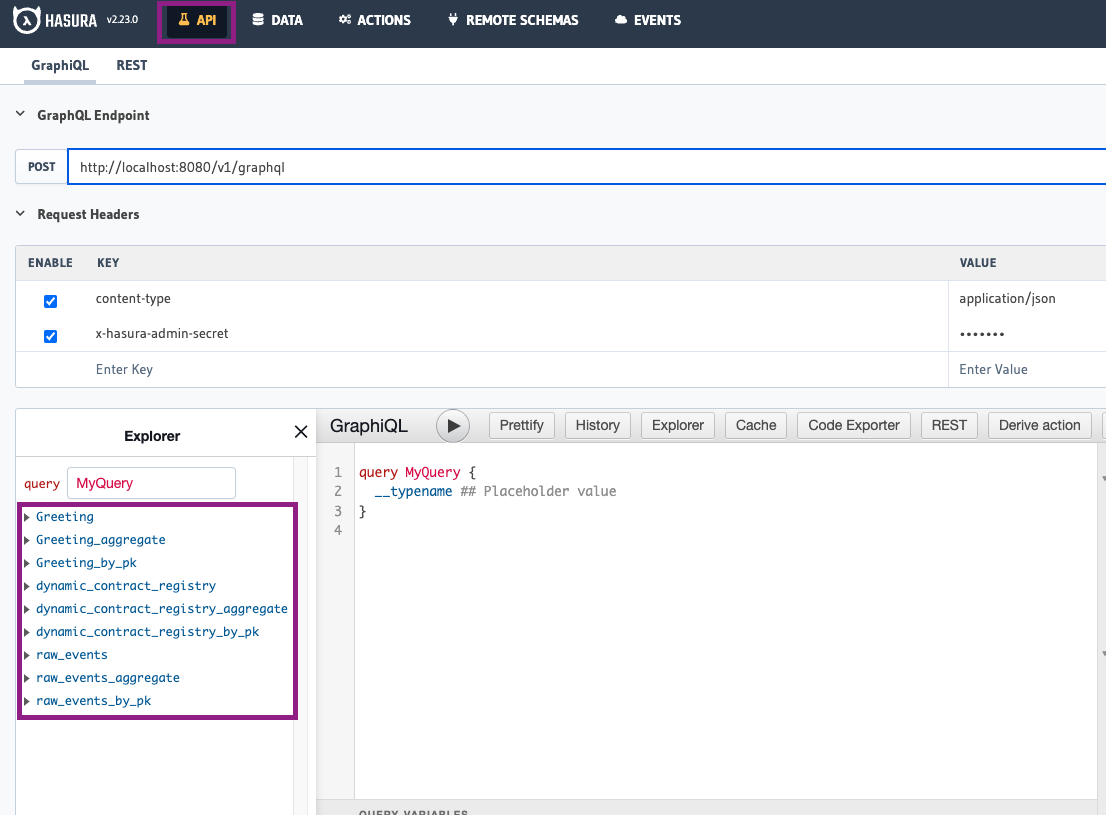
Features
- Explorer Panel: The left panel shows all available entities defined in your
schema.graphqlfile - Query Builder: The center area is where you write and execute GraphQL queries
- Results Panel: The right panel displays query results in JSON format
Available Entities
By default, you'll see:
- All entities defined in your
schema.graphqlfile dynamic_contracts(for dynamically added contracts)raw_eventstable (Note: This table is no longer populated by default to improve performance. To enable storage of raw events, addraw_events: trueto yourconfig.yamlfile as described in the Raw Events Storage section)
Example Query
Try a simple query to test your blockchain indexer:
query MyQuery {
  User(limit: 5) {
    id
    latestGreeting
    numberOfGreetings
  }
}
Click the "Play" button to execute the query and see the results.
For more advanced GraphQL query options, see Hasura's quickstart guide.
Data Tab
The Data tab provides direct access to your database tables and relationships, allowing you to view the actual indexed data.
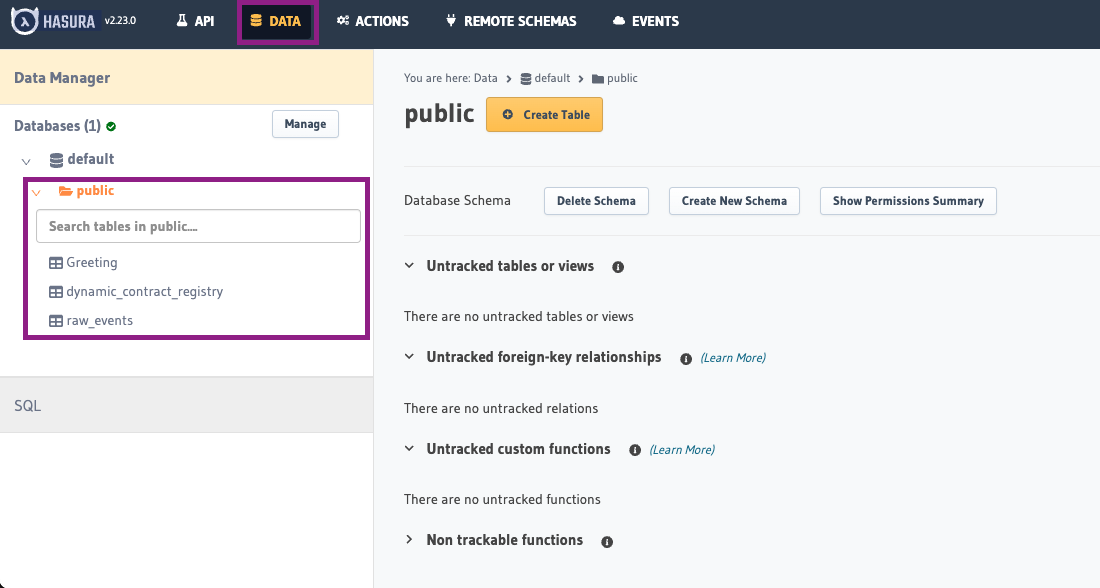
Features
- Schema Browser: View all tables in the database (left panel)
- Table Data: Examine and browse data within each table
- Relationship Viewer: See how different entities are connected
Working with Tables
- Select any table from the "public" schema to view its contents
- Use the "Browse Rows" tab to see all data in that table
- Check the "Insert Row" tab to manually add data (useful for testing)
- View the "Modify" tab to see the table structure
Verifying Indexed Data
To confirm your blockchain indexer is working correctly:
- Check entity tables to ensure they contain the expected data
- Query the
envio_chainstable (or use the Metadata Query API) to see each chain's latest processed block and confirm the indexer is making progress
Common Tasks
Checking Indexing Status
To verify your blockchain indexer is actively processing new blocks:
- Go to the Data tab
- Select the
envio_chainstable (or query the Metadata Query API) to see each chain's latest processed block - Monitor those values over time to ensure they're advancing
(Note the TUI is also an easy way to monitor this)
Troubleshooting Missing Data��
If expected data isn't appearing:
- Check if you've enabled raw events storage (
raw_events: trueinconfig.yaml) and then examine theraw_eventstable to confirm events were captured - Verify your event handlers are correctly processing these events
- Examine your GraphQL queries to ensure they match your schema structure
- Check console logs for any processing errors
Resetting Indexed Data
When testing, you may need to reset your database:
- Stop your indexer
- Reset your database (refer to the development guide for commands)
- Restart your indexer to begin processing from the configured start block
Best Practices
- Regular Verification: Periodically check both the API and Data tabs to ensure your blockchain indexer is functioning correctly
- Query Testing: Test complex queries in the API tab before implementing them in your application
- Schema Validation: Use the Data tab to verify that relationships between entities are correctly established
- Performance Monitoring: Watch for tables that grow unusually large, which might indicate inefficient indexing
Aggregations: local vs hosted (avoid the foot‑gun)
When developing locally with Hasura, you may notice that GraphQL aggregate helpers (for example, count/sum-style aggregations) are available. On Envio Cloud, these aggregate endpoints are intentionally not exposed. Aggregations over large datasets can be very slow and unpredictable in production.
The recommended approach is to compute and store aggregates at indexing time, not at query time. In practice this means maintaining counters, sums, and other rollups in entities as part of your event handlers, and then querying those precomputed values.
Example: indexing-time aggregation
schema.graphql
# singleton; you hardcode the id and load it in and out
type GlobalState {
  id: ID! # "global-state"
  count: Int!
}

type Token {
  id: ID! # incremental number
  description: String!
}
EventHandler.ts
import { indexer } from "envio";

const globalStateId = "global-state";

indexer.onEvent(
  { contract: "NftContract", event: "Mint" },
  async ({ event, context }) => {
    const globalState = await context.GlobalState.get(globalStateId);

    if (!globalState) {
      context.log.error("global state doesn't exist");
      return;
    }

    const incrementedTokenId = globalState.count + 1;

    context.Token.set({
      id: incrementedTokenId,
      description: event.params.description,
    });

    context.GlobalState.set({
      ...globalState,
      count: incrementedTokenId,
    });
  },
);
This pattern scales: you can keep per-entity counters, rolling windows (daily/hourly entities keyed by date), and top-N caches by updating entities as events arrive. Your queries then read these precomputed values directly, avoiding expensive runtime aggregations.
Exceptional cases
If runtime aggregate queries are a hard requirement for your use case, please reach out and we can evaluate options for your project on Envio Cloud. Contact us on Discord.
Disable Hasura for Self-Hosted Blockchain Indexers
Set the ENVIO_HASURA environment variable to false to disable Hasura integration for self-hosted blockchain indexers.
For more information on using GraphQL with your indexed data, refer to the Hasura GraphQL documentation.